Free Online Audio Plot Spectrum
Unlike a spectral frequency analyzer which shows real-time frequency magnitudes over time, the plot spectrum is a way to instantly see how often a specific frequency is found in an audio file as a whole instead of moment-to-moment over time. The higher the peak, the more often that specific frequency is present in the audio file. A fast fourier transform (FFT) algorithm is used to give a value for each narrow band of frequencies that represents how much of those frequencies is present in a given audio clip. All the values are then interpolated to create the graph. The plot spectrum takes the audio in blocks of 'size' samples, does the FFT, and averages all the blocks together.
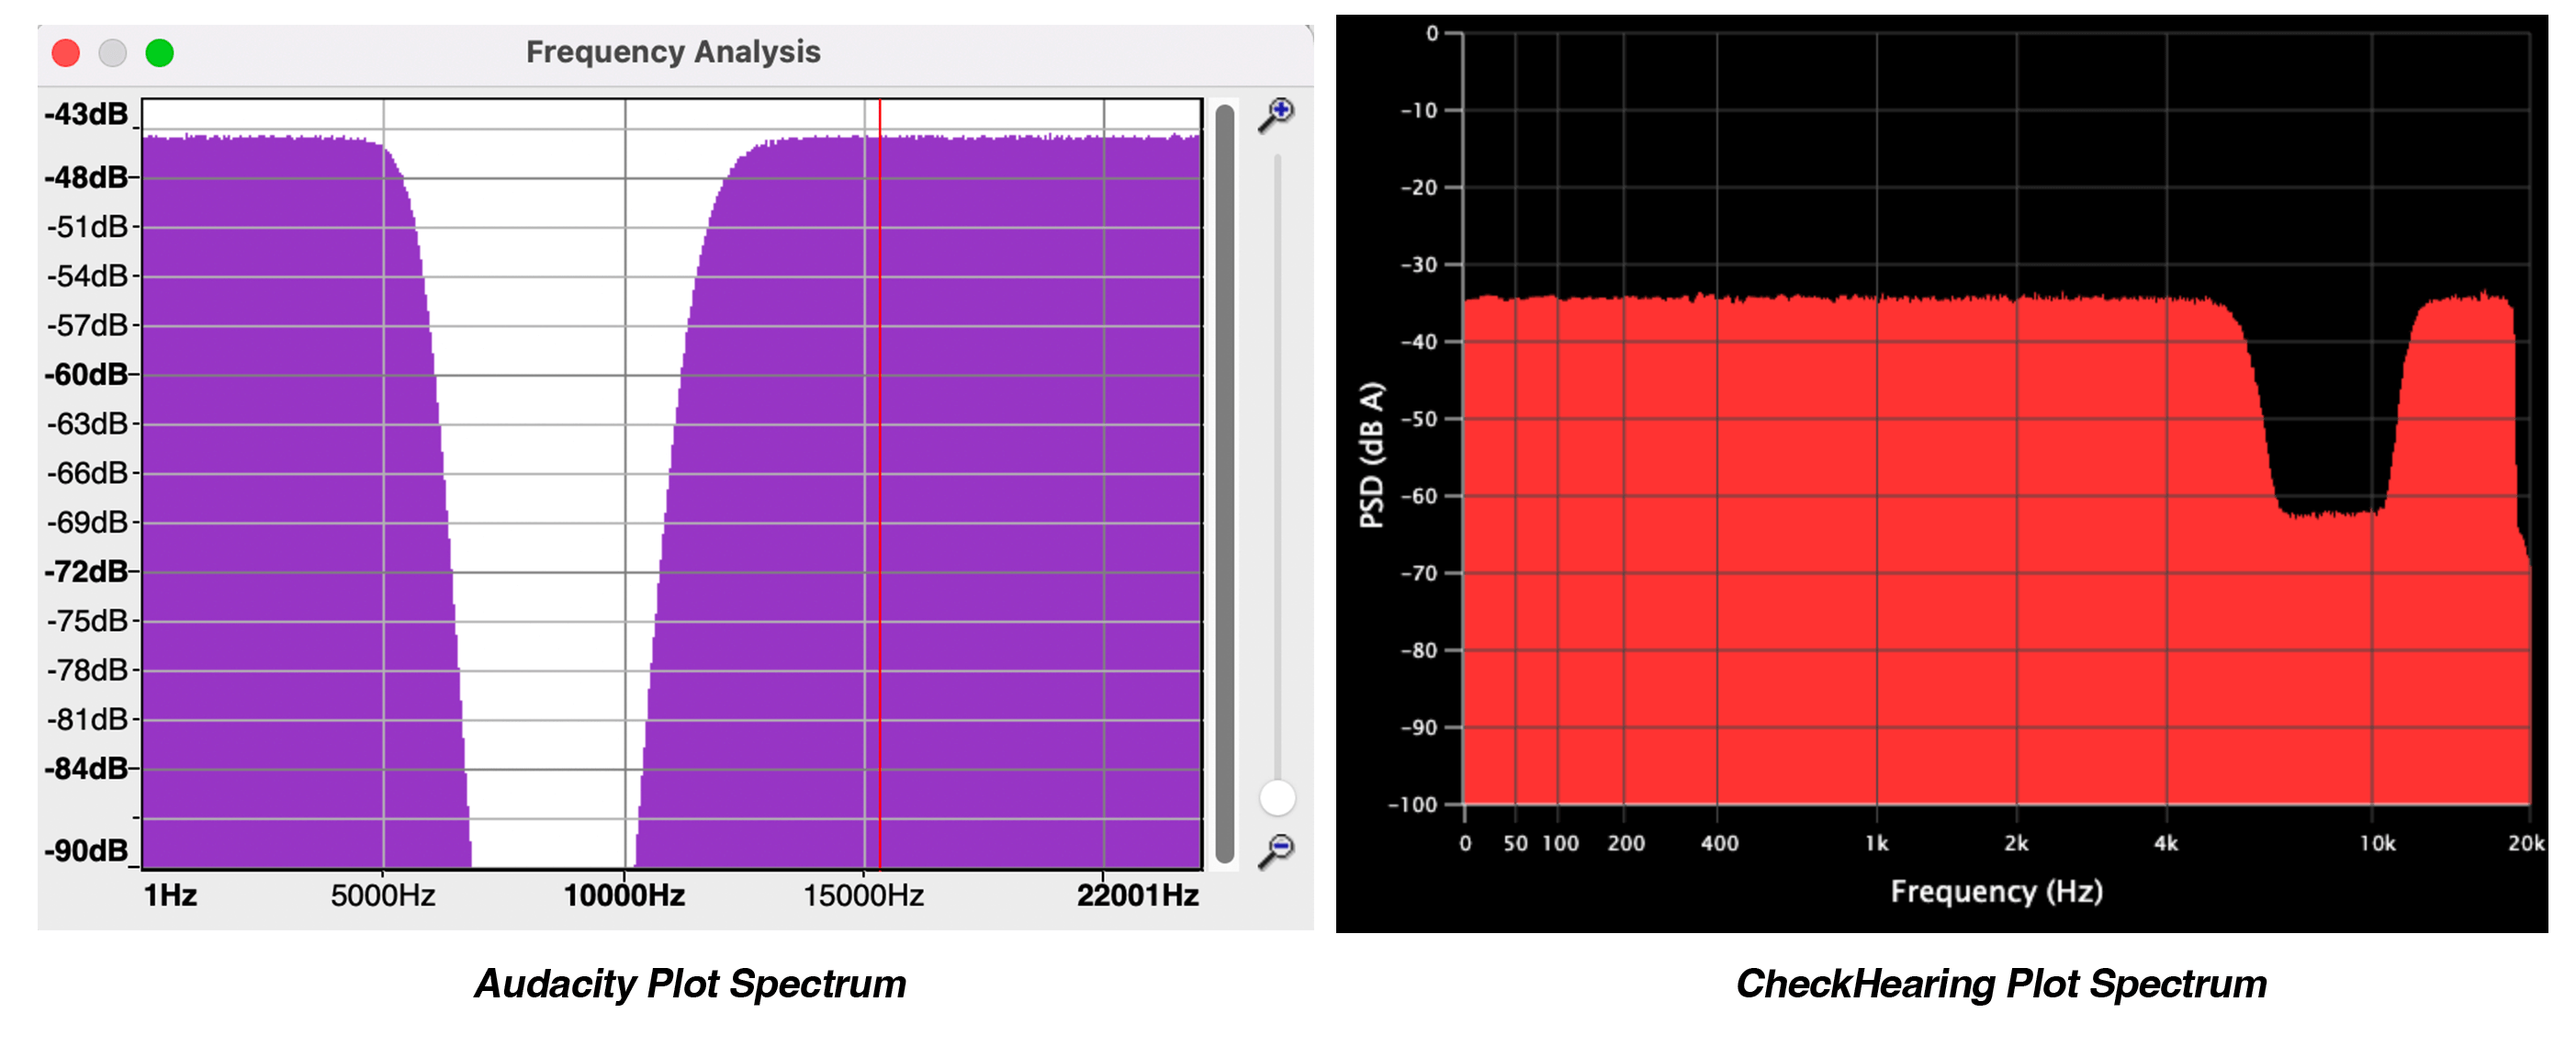
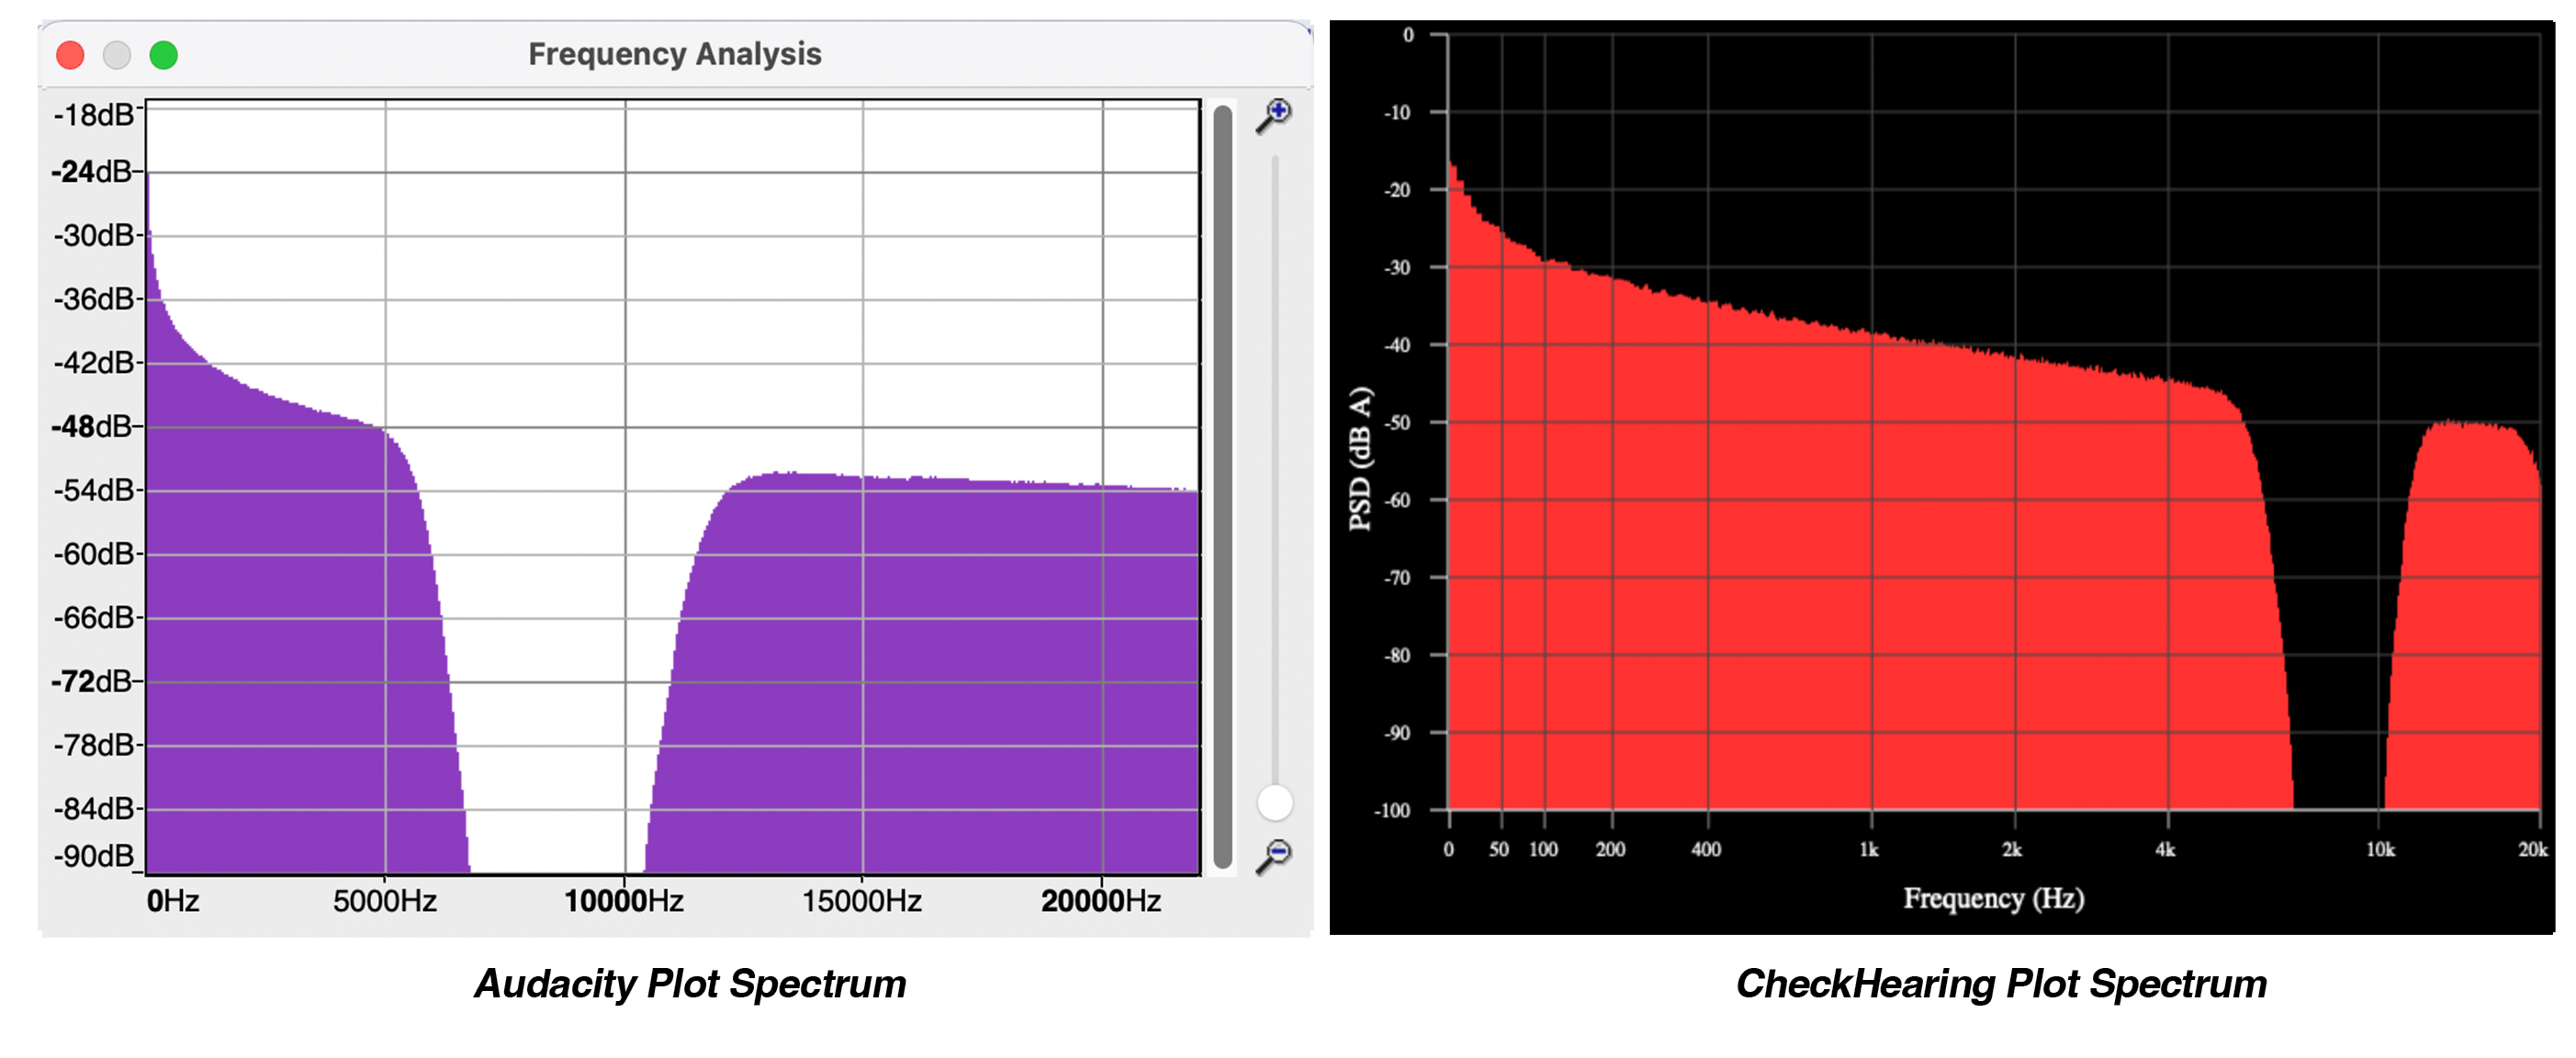
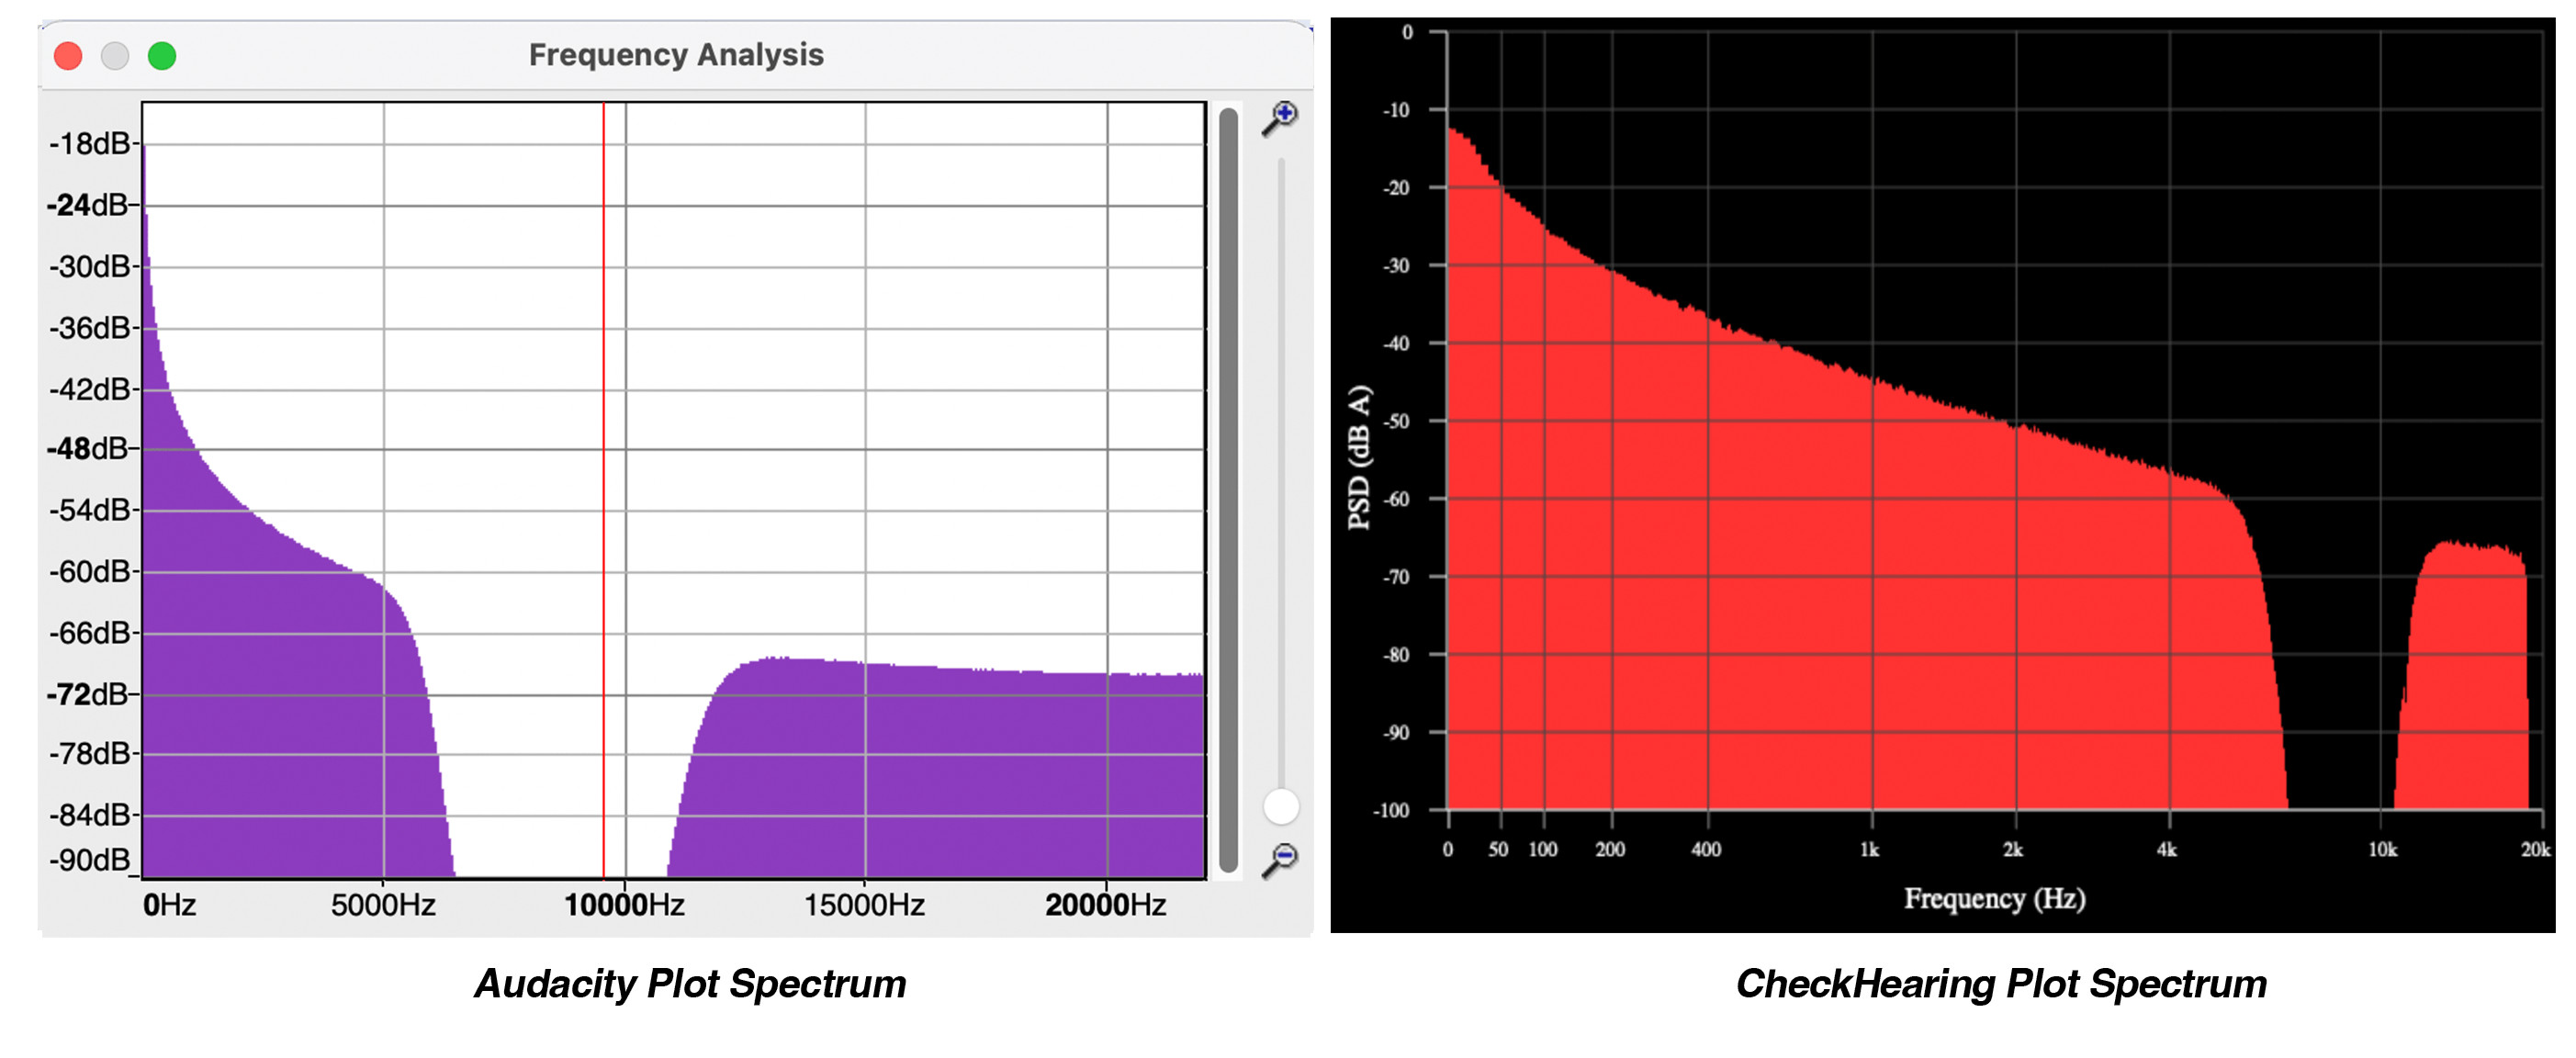
For those familiar with the free open-source program, Audacity, this webpage functions similarly to Audacity's plot spectrum tool.
To use this program, simply click the green "Load Audio" button below and select the audio clip you want analyzed. The file types this program will accept include wav, mp3, and flac among many others.
This program will only analyze the first 1 minute of the uploaded audio using FFT sampling size of 8192. You can gain access to a PRO version of this webpage ($10) if you desire to change the audio duration to be analyzed as well as the FFT sample size. Audacity's plot spectrum tool only analyzes the first 3 minutes of a sound clip.
If you desire real-time spectral frequency analysis of uploaded sound files click here. If you desire to analyze the sound coming through the microphone, click here.
** PLEASE NOTE! This webpage is best viewed and used on a desktop computer!
** PLEASE NOTE! If you have any problems getting this webpage to work, please try using the Chrome browser instead and make sure javascript is enabled!