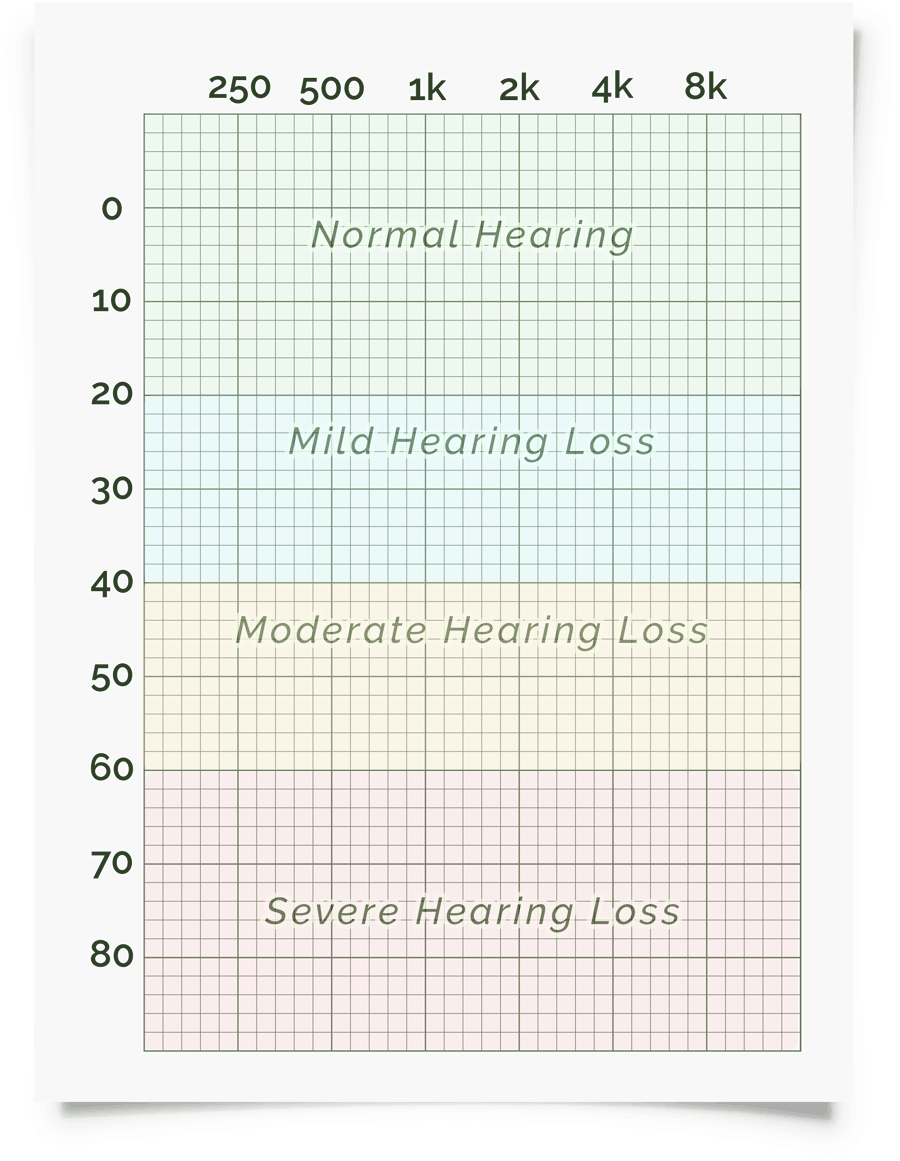
How to Read an Audiogram

Horizontally across the top portrays frequency in Hz with low frequencies on the left starting at 250 Hz and high frequencies on the right side ending with 8K Hz. The higher this number, the higher the pitch. The lower this number, the lower the pitch.
The vertical axis depicts loudness levels in decibels (dB) with normal sound levels being anything less than 20 dB. The higher this number, the louder the tones before being heard. The larger this number, the greater the degree of hearing loss. Once you get down towards 80 dB, the person being tested would be considered effectively deaf for that particular frequency.
The blue "X" is your left ear hearing and the red "O" is your right ear hearing.
If you desire one of our professionals to interpret a hearing test performed on the CheckHearing platform ($5 per test), click here.
Average hearing results by age and gender can be found here.