Want to print a nice looking report? There is a $20 annual charge. More info below. Sample Report.
Instructions On Use
** PLEASE NOTE! If you have any problems getting
this webpage to work, please try using the Chrome browser
instead and make sure javascript is enabled! At this time, we do not support use of this program over
video-conferencing (ie, Zoom, Google Meet, etc.)
STEP 1: Calibration and testing is best performed using headphones in a quiet room or
better yet, a sound-proof booth. Press the BLUE Test Room button
to
get a rough sense (given differences in microphone sensitivity among different devices) of
how quiet the room is. Click here to learn how the online sound meter calculates this score using your device's microphone and
how you can calibrate it to provide accurate information. In a
home, the most quiet room typically would be in a closet full of clothes.
If there is some unavoidable noise in the room, using a noise-cancelling headphone will help improve accuracy. Using
headphones, listen to the hand rub calibration audio file. Then,
without your headphones on, rub your hands together closely in front of your nose, quickly and firmly.
Keep adjusting the computer/device volume so that the sound volume from the calibration file through your
headphones and your
hands rubbing without headphones are equally loud. For most but not all devices, this volume level is
typically
found at about 75% of the maximum volume. Once matched, do NOT adjust the volume once testing begins in
step 2.
For greater calibration precision, one can use a professional sound meter (a decent one costs around $20)
to ensure sound output from the headphones is 55±3 dB. Alternatively, you can try using our online sound meter (assuming this has been calibrated) to perform this
headphone calibration (watch video of how to perform a headphone calibration using a sound
meter).
If you are unable to hear the sound of your hands rubbing, stop the calibraton process as you are suffering
from
a severe hearing loss! Have a different person perform this calibration.
Once calibrated to a given computer/device/room/headphones set, this calibration should be performed
periodically
to maintain accuracy. For further quality control, hearing test results should be compared to a known formal
audiogram.
Please note that this test has been verified to achieve accurate air conduction hearing test results.
However,
bone conduction test results have not been verified for accuracy though it can also be performed with this
online test.
STEP 2: The BLUE grid tests the left ear
and
RED grid tests the right ear. In an environment identical to where
calibration was performed, starting from the top row, move down one by one until the patient hears a tone at
which point you stop and move on to the next column. Do this for all columns. To reiterate, stop with the
file
whose tone becomes just audible before switching to the next column.
Be aware that if you play the next tone before the current tone is finished playing, it may cause the testing
board icons to become "stuck." Everything still works however and correct results will still be shown. But,
you
may have to refresh entire webpage in order to get icon images unstuck and display correctly.
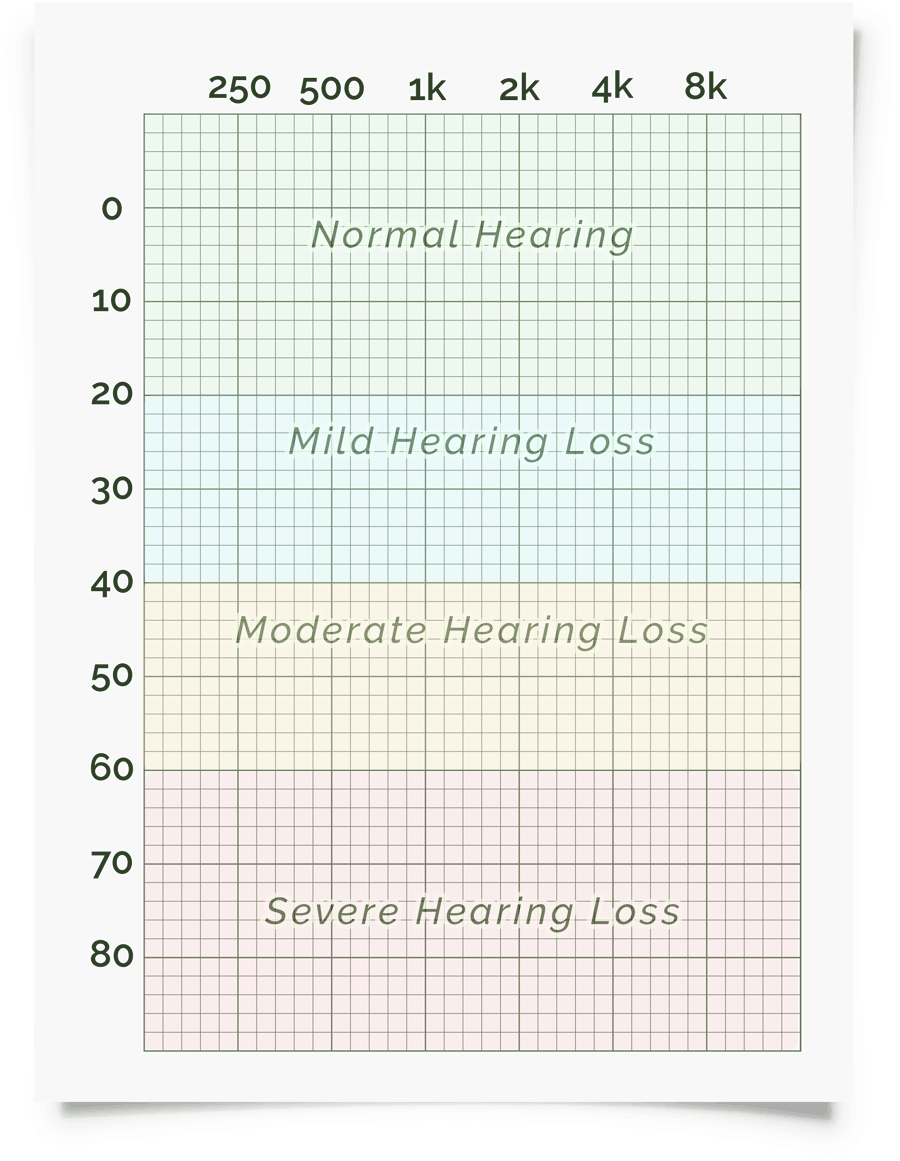
STEP 3: The results of the hearing test should automatically appear in the audiogram
chart.
The 'Overlay' button adds further sound info within the audiogram.
The first overlay outlines an image known as the "speech banana" and describes the area within which
different
alphabetical sounds exist during regular talking. Vowels are located on the left green side while consonants
are
present within the right blue area. If your results are within or below the speech banana, conversational
sounds
will be either muffled or even completely inaudible causing an individual to either misunderstand part of or
unable to understand any speech conversations.
The second overlay shows where everyday familiar sounds are present.
PRINTING REPORTS: The ability to print nice-looking reports is possible after a
one-time
$20 charge for 1 year's use. A private token will be provided for you to use in order to print reports for
all
future testings. Sample Report.
LEGAL STUFF: The tones and code for the online audiometer have been licensed from Dr. Stephane Pigeon (the original
online hearing test can be found here) for use by
Dr. Christopher Chang.
Please do not copy any parts of this webpage. The code and tones have been watermarked to prevent
unauthorized
use in other websites.
TECHNICAL STUFF: An online hearing test runs in a completely uncontrolled environment
and
will never replace the calibrated test performed in a sound proof booth with a professional audiologist. The
audio files are based on the ISO 389-7:2005 international standard and use third octave band warble tones in
order to minimize room and headphone resonance. ISO 389-7:2005 is the standard recommended by the British
Society of Audiology as it does not rely on a particular type of headphone.